Simple Excel Budget Spreadsheet: Setup & Formulas
How do I create a simple budget spreadsheet in Excel?
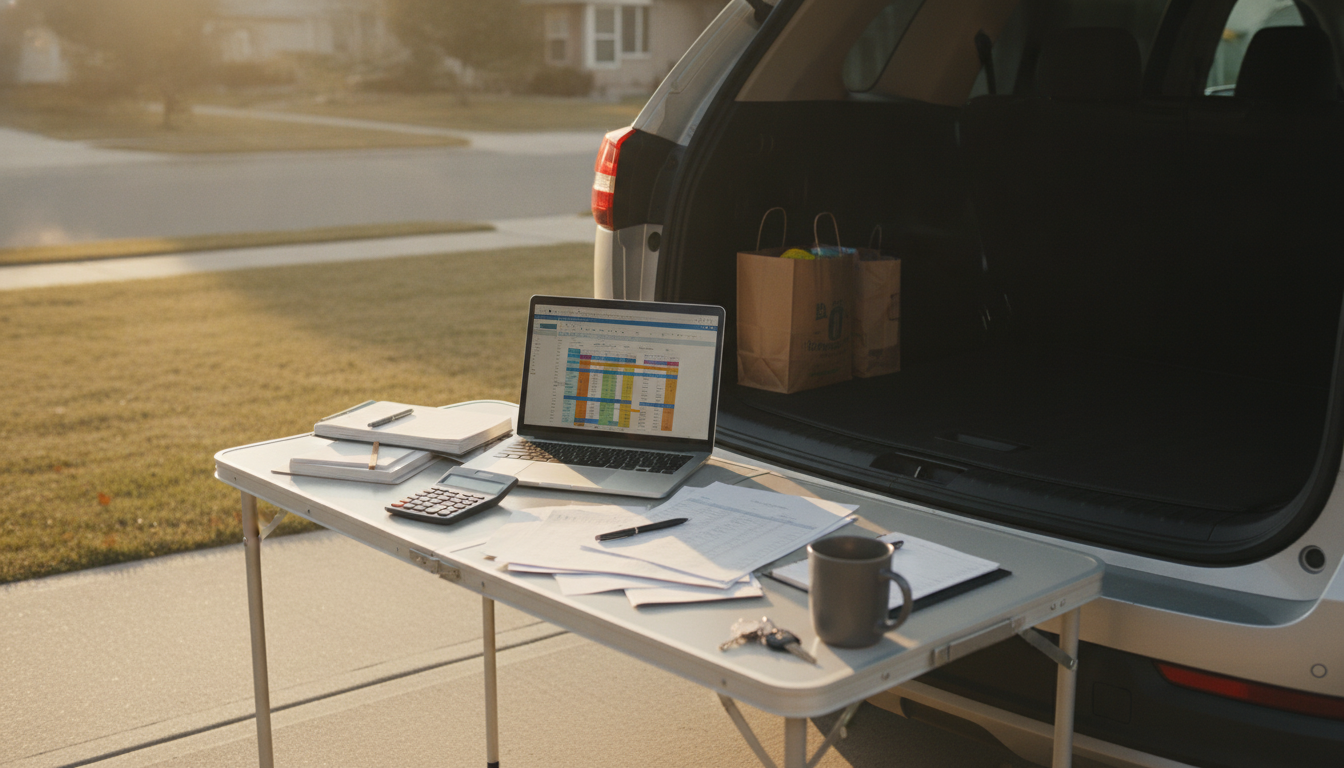
A simple Excel budget spreadsheet only needs three things: a place to list income, a place to list expenses, and a quick way to see the difference. Start with a clean workbook and build it so it’s easy to update weekly or monthly.
1) Set up your columns
In Row 1, add headers like: Date, Description, Category, Planned, Actual. This layout lets you compare what you expected to spend versus what really happened.
2) Create basic category lists
In the Category column, use consistent labels (Housing, Utilities, Groceries, Transportation, Subscriptions, Debt, Savings, Entertainment, Misc.). Consistency matters because your totals will depend on matching category names.
3) Add monthly totals with simple formulas
Below your table (or on a second sheet called “Summary”), calculate totals:
Total Income: add income lines with SUM. Total Expenses: add expense lines with SUM. Then create Net as =Total Income – Total Expenses. If you separate income and expenses into different sections, the formulas stay straightforward.
4) Track planned vs. actual
For each category, total the Planned and Actual amounts (using SUMIF by category if you want a quick upgrade). Add a Difference column as =Planned – Actual so overspending stands out immediately.
5) Make it easier to read
Convert your data range into an Excel Table (so it auto-expands), freeze the header row, and apply conditional formatting to highlight negative net totals or category overruns.
6) Build a repeatable routine
Update transactions regularly, reconcile with your bank statements, and adjust the next month’s plan based on what actually happened. For more ways to plan, track, save, and stay consistent, see this guide: https://prestigal.com/guide-empowered-budgeting-toolkit-plan-track-save-repeat/.
For Simple Excel Budget Spreadsheet: Setup & Formulas, the best answer depends on fit, material, care instructions, and how the product will be used day to day.
FAQ
What are the best budget categories to start with?
Start with the categories that cover most spending: housing, utilities, groceries, transportation, debt payments, and savings. Add smaller categories (subscriptions, dining out, personal spending) once the basics are working.















Leave a comment